Understanding Histrograms: Part I
Excerpt from the Canon Boot Camp Manual
Histogram Introduction
Histogram comes from the Greek word “histos” “mast” and English word “gram”. You could call it a type of graph.
The Canon can display a histogram over the picture you are taking and it eliminates, to a great extent, the need for a light meter. It helps you see if your shot is too bright or too dark.
BACKGROUND
Technically a histogram came from the field of statistics. Most people call it a “graph”. There’s an X axis (horizontal line) and a Y axis (the vertical line). So the histogram (graph) shows the values plotted along the axes.
For example, the stock exchange report is a histogram. It shows quantity of money at a given time.
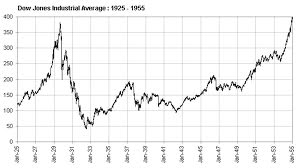
It plots how the cost of a stock over a span of time.
OTHER TYPES OF HISTOGRAMS
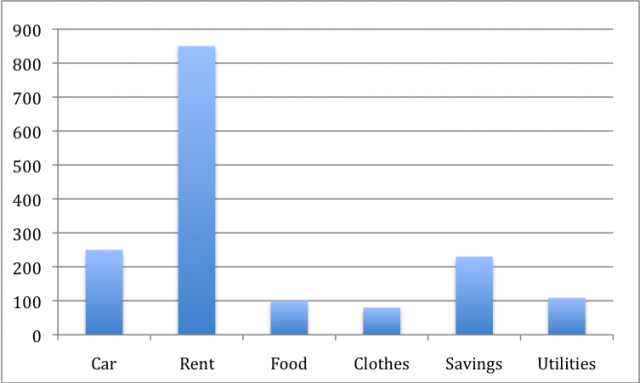
This budget histogram (graph) shows the quantity of money spent in different categories.
This histogram (below) might be something a dog breeder keeps. It shows the quantity of dogs they have grouped by black and white values.
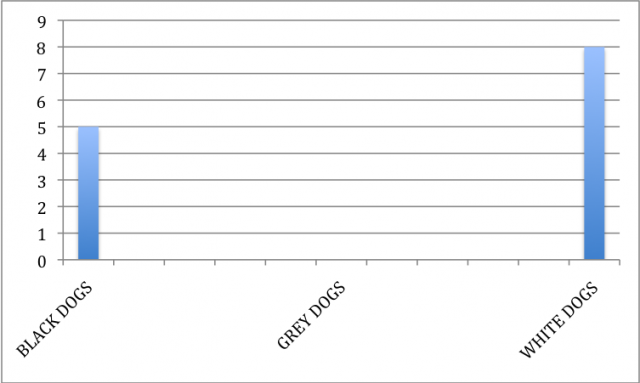
DRILL: Add a column that shows 3 grey dogs.