Understanding Histograms: Part II
Excerpt from the Canon Boot Camp Manual
A CAMERA’S HISTOGRAM
Histograms in cameras total how many sensors are reporting a certain value of light and then build a graph to visualize that.
The picture below is of a grey scale. It shows values of light from black to white. The values of light go from 0 (black) to 255 (white). The line along the bottom is marked by the values of 0 (darkest) on the left and 255 (brightest) on the right. 18% grey is right in the middle.
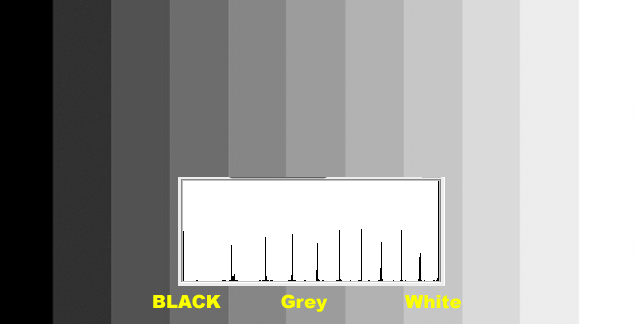
0% 177 255 18% Gray
The spikes show the amount of pixels reporting that tonal value. In the above picture, the sensors are picking up nearly identical quantities in a range of tones from black to white. The grey scale isn’t perfect. You can notice the left edge of each column of grey is slightly lighter that the other edge. This is why some of the spikes are slightly taller than others.
You can see there are stacks for each of the shades of grey until it reaches complete white. The white spike (and the black spike are hard to see because they are up against the sides of the histogram.
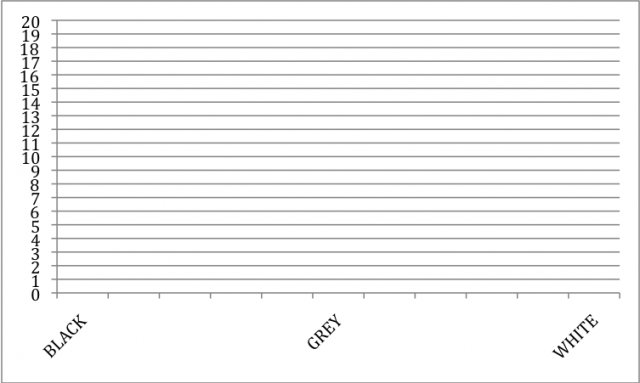
Draw a histogram of what tone the pixels are sensing.
Let’s say you have a camera with only 15 pixels on the sensor. Below each circle represents a pixel on your camera’s sensor. Pixels measure light. The histogram uses these “reports” from each pixel to build the columns of the histogram.
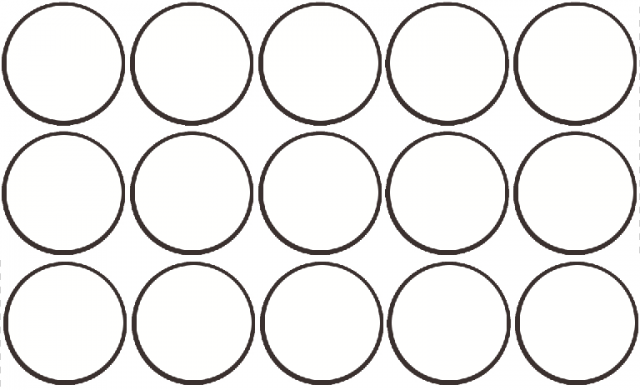
DRAW : The column the histogram would build if all 15 sensors were reporting absolute white.
Practice your understanding of histograms by printing off the picture below and drawing in the column.
Pixels “seeing” different values of light.
Now here’s the same sensor but it is “seeing” different values or tones of black, grey and white.
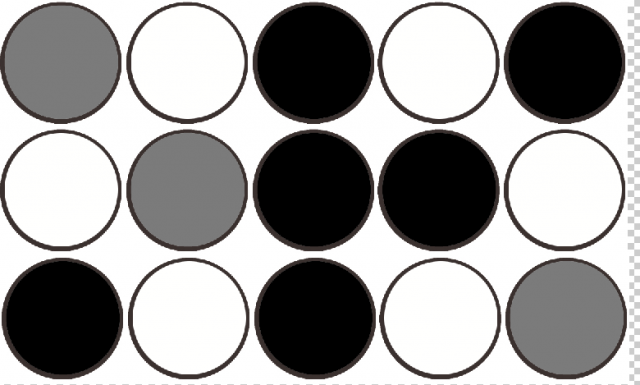
Draw in the number of pixels reporting each of the tones. Assume the greys are exactly the value in the middle of the histogram, i.e. 18% grey.
