Understanding Histograms: Part III
Excerpt from the Canon Boot Camp Manual
What each pixel “sees” and reports.
Now we’re going to zoom into the picture below with our 15 pixel camera. We’re going to see what light value each pixel “sees” on a tiny bit of the picture. This is the value the pixel reports. These reports are grouped and built into a histogram.
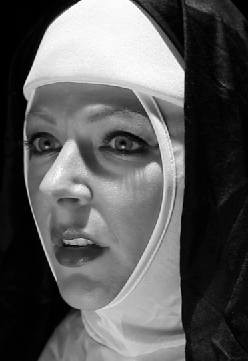
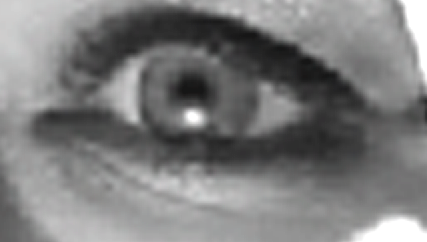
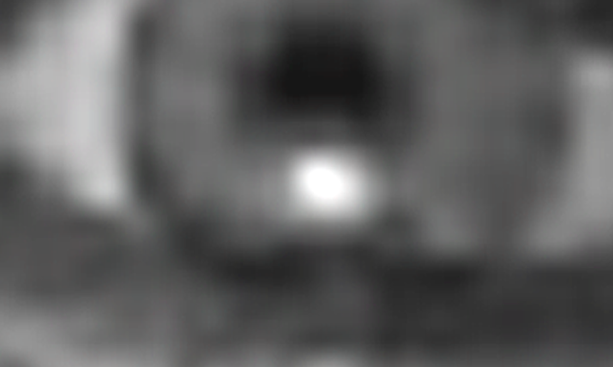

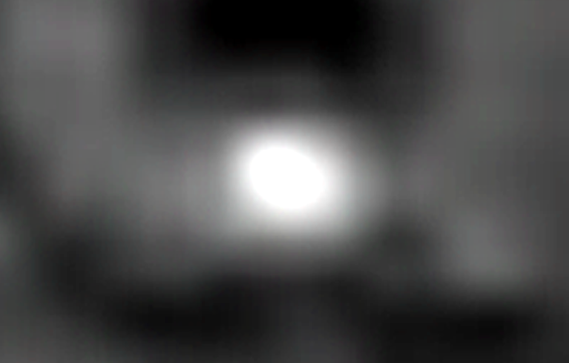
Below is what our 15 pixel sensor sees of the picture above.
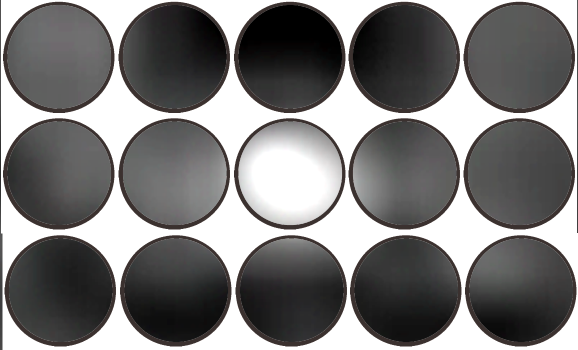
There are pixels that are mostly black and some “black/grey” to “dark grey” and one pixel that is closer to white but not white white….not 255 on the histogram.
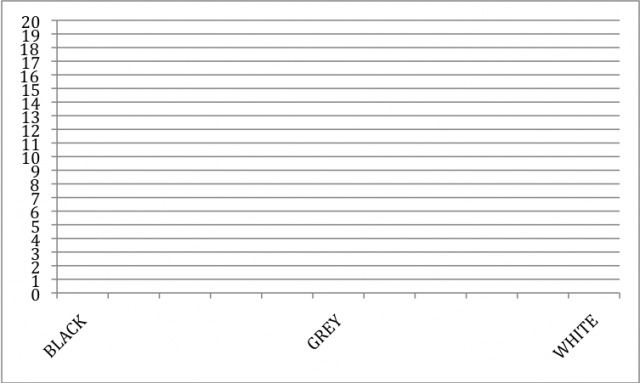
DRAW what value each pixels on the sensor ”sees”. In other words, count the nearly black pixels and draw a column representing them. Count the “darker blacks” and draw a column of those. Count the pixels reporting “white” values and draw a column of those. Count the grey values into groups and draw a columns of those groups, i.e. milky black, black grey, dark grey, Or name your own groups and total the number of pixels in each group.